

In crypto trading, volume is one of the most crucial yet often overlooked indicators. Understanding the volume means and how it affects crypto markets can be a game changer for traders, whether you’re a seasoned investor or just getting started!
But what exactly does trading volume mean in the context of cryptocurrencies? How can it impact your trading decisions, and why is it so important? In this blog, we’ll delve into the importance of volume in crypto markets, explain how it can help you predict market trends, and how to leverage volume in your trading strategies.
But what is the trading volume in cryptocurrency?
Simply put, trading volume is the total number of units of a particular cryptocurrency traded over a specific period. In crypto, volume is a powerful tool to assess market interest, price movements, and trends.
When you're looking at price charts, volume is typically displayed as a histogram beneath the price chart, giving you a visual representation of trading activity.
Volume in crypto trading is important because it:
- Provides insight into market liquidity, market sentiment, and trend strength
- Helps traders make informed decisions about potential price movements, entry, and exit points
- Serves as a confirmation tool for price movements and helps traders gauge the market's overall health and stability
By the end of this blog post, you will have a thorough understanding of how to interpret volume in crypto trading, why it's vital, and how to incorporate volume into your trading strategies for success.
Concept of Trading Volume
In any market, whether traditional or digital, volume refers to the number of trades executed within a specific period—typically measured in the number of tokens, shares, or contracts traded. In the crypto space, volume refers to the total number of coins or tokens traded during a specified period, whether on centralized exchanges like Binance or Coinbase, or decentralized platforms such as Uniswap
For example, if you're looking at Bitcoin (BTC) on a 1-hour chart and see a volume bar showing 10,000 BTC, it means 10,000 Bitcoin were traded in that hour.
Unlike traditional financial markets with fixed hours, the crypto market operates 24/7. This continuous operation allows for real-time tracking of volume, offering an unbroken flow of data. On charts, trading volume is often displayed as a histogram beneath the asset’s price chart, with bars representing the number of units traded during a particular time interval.
How is Volume Calculated in Crypto?
Volume is calculated by adding up the total number of coins or tokens traded during a specific period. For example, if 500 BTC were bought and sold within an hour, the volume for that period would be 500 BTC. This data is then visually represented on price charts, helping traders understand the level of market activity.
Why Volume is Important in Crypto
Volume plays an important role in determining the strength of market trends and provides vital information about liquidity and market sentiments.
Volume Indicates Market Liquidity
Liquidity refers to the ease with which an asset can be bought or sold in the market without affecting its price. Higher volume means there are many buyers and sellers in the market, making it easier to buy or sell your crypto at a fair price. This is important for large-cap cryptocurrencies like Bitcoinz and Ethereum, where liquidity ensures smooth trading. Conversely, low volume in smaller cryptocurrencies might lead to price slippage—where your trade is executed at a price that’s different from what you expected.
Volume and Price Correlation
Volume can serve as a confirmation signal for price movements.
When the price rises with high volume, it typically indicates that there’s strong buying interest, supporting the idea of a bullish trend.
On the other hand, when prices rise but the volume is low, it might suggest a lack of conviction in the rally, signaling a potential price reversal or consolidation.
Volume as a Sentiment Indicator
High volume on a price increase suggests strong bullish sentiment, while high volume on a price decline indicates bearish sentiment.
Conversely, low volume during price fluctuations can indicate indecision in the market. Volume can be a crucial metric for identifying periods of market uncertainty, especially during market consolidation.
Types of Volume Analysis
Some of the other most popular types of volume indicators that traders use are:
On-Balance Volume (OBV)
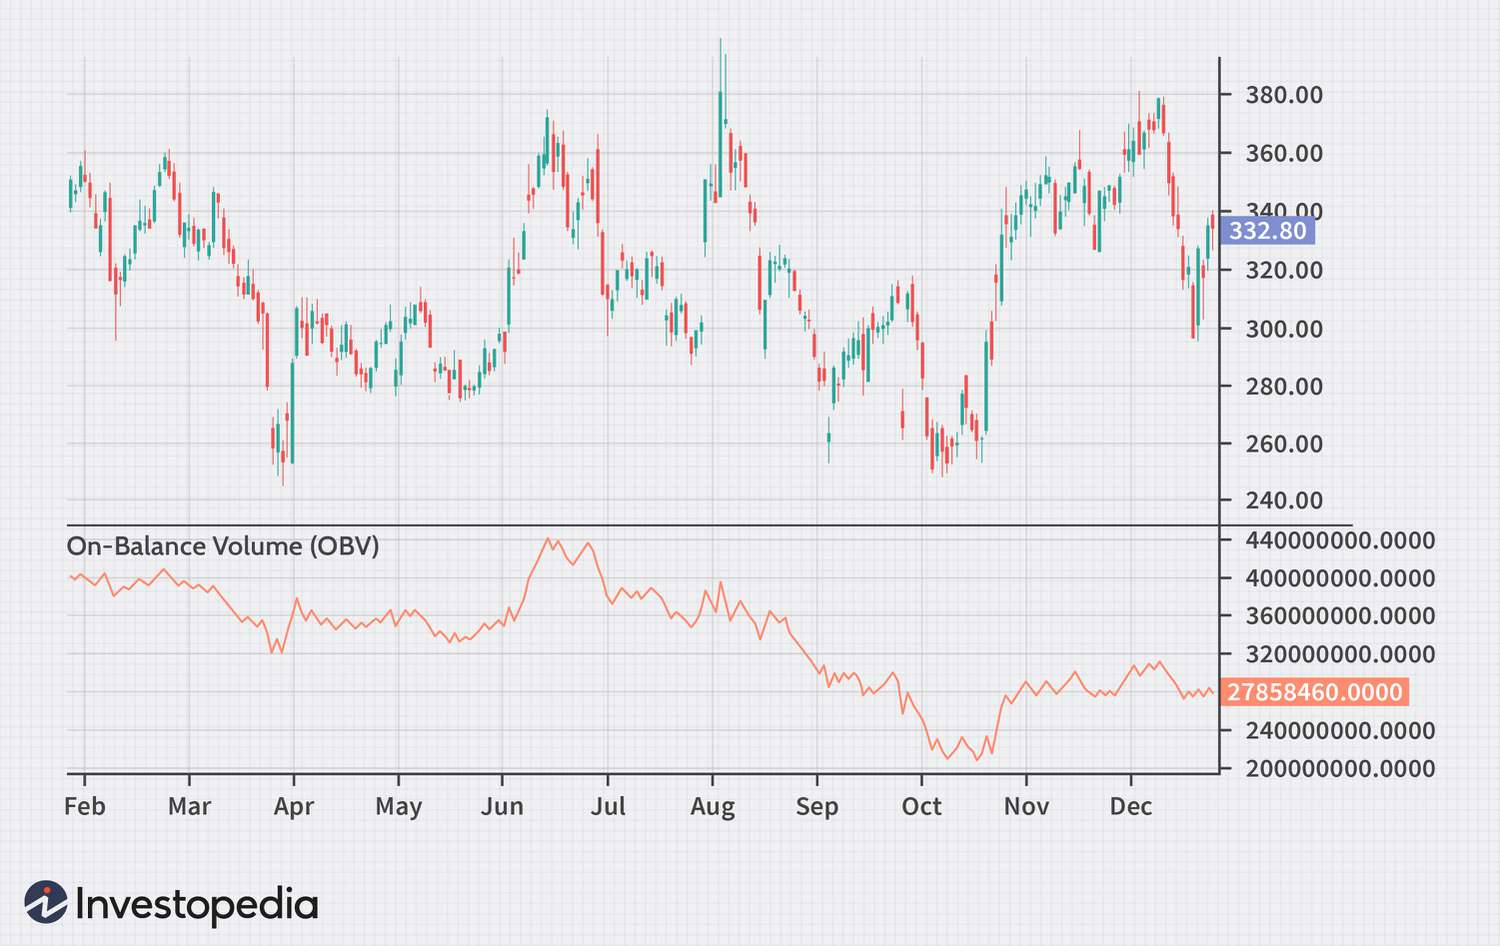
The On-Balance Volume (OBV) is a popular volume indicator that helps traders identify trends by measuring buying and selling pressure. The indicator adds volume on up days and subtracts volume on down days.
A rising OBV indicates increasing buying pressure, while a falling OBV suggests selling pressure. OBV can be used to confirm bullish or bearish trends.
Chaikin Money Flow (CMF)
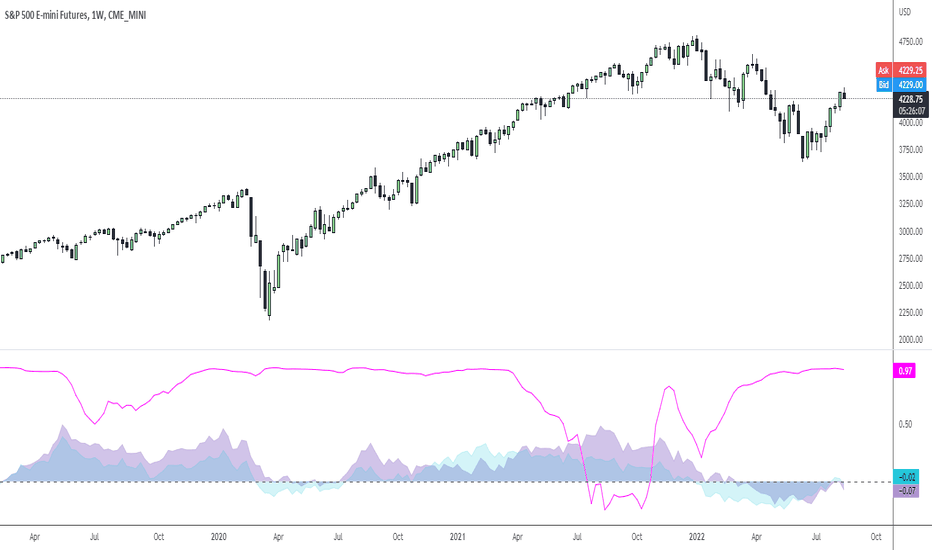
Chaikin Money Flow (CMF) measures the cumulative flow of money into or out of an asset over a set period.
When the CMF is positive, it suggests accumulation or buying pressure, and when it’s negative, it indicates distribution or selling pressure.
Accumulation and Distribution Phases
One interesting phenomenon is the “accumulation” and “distribution” phase in markets, particularly relevant in crypto trading.
Accumulation occurs when large investors (whales) or institutional players are quietly building positions in an asset, typically during periods of low volume and price consolidation.
Distribution, on the other hand, happens when these players start selling off their holdings, often resulting in high-volume spikes as they attempt to exit their positions.
Volume and Price Divergence
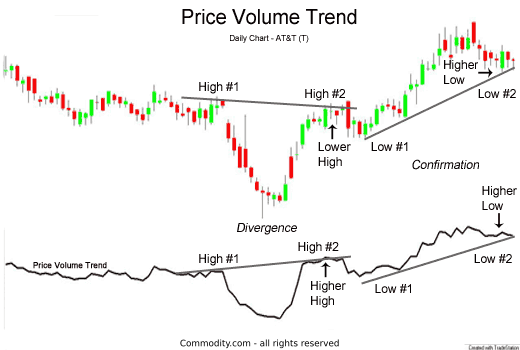
Image: Source
A significant concept in volume analysis is the idea of divergence between price and volume. Generally speaking, volume confirms price action. When the price increases but volume decreases, it might indicate a weakening trend or a potential reversal.
For example, if Bitcoin’s price is rising but the trading volume is declining, it may signal that the rally lacks strong buying support and could eventually lead to a price pullback.
Conversely, when price and volume both rise, it generally confirms that the trend is strong. Divergence between volume and price can be an early signal of a trend reversal, so watching for these signs is crucial for smart trading.
Volume Trading Strategies

Volume trading strategies are essential for navigating the cryptocurrency market effectively. These strategies help traders analyze market activity, identify trends, and make informed decisions.
Here are some common volume trading strategies used in cryptocurrency markets:
Scalping
Scalping is a high-frequency trading strategy that involves making numerous small trades throughout the day to capitalize on minor price fluctuations. It is particularly popular in cryptocurrency markets due to their inherent volatility.
Key Elements of Scalping:
- Prefer assets with high liquidity and volatility, such as BTC/USDT or ETH/USDT
- Use indicators like Moving Averages, MACD, and RSI to gauge momentum and identify entry/exit points.
- Use trading bots to execute trades quickly and manage the high volume of transactions required
Breakout Trading
Breakout trading involves entering a trade when the price breaks out of a consolidation pattern or resistance level. High volume during a breakout indicates strong market support for the price movement, making it a more reliable signal.
Indicators like Moving Averages and Bollinger Bands help identify potential breakout points.
Trend Following
Trend following strategies involve identifying and following the direction of market trends. Volume analysis is crucial here, as increasing volume often confirms the strength of a trend.
Indicators like On Balance Volume (OBV) and Moving Averages help gauge trend momentum.
Volume-Based Trend Confirmation
This strategy involves using volume to confirm price trends. A price increase accompanied by rising volume is considered bullish, while a price drop with increasing volume is bearish.
The volume and price correlation and divergence analysis are used to confirm trends and confirm potential reversals.
Indicators like OBV help identify volume trends.
Volume-by-Price Analysis
This strategy involves analyzing volume at different price levels to identify areas of strong support or resistance. High volume at specific price points can indicate where "smart money" is entering or exiting positions. Identifying areas where volume is high to predict future price movements.
Tools like volume profiles help visualize volume distribution across price levels.
Here are some long term investment strategies you must know: Guide to long-term crypto investment strategy
Challenges and Limitations of Volume Analysis in Crypto

Despite its significance, volume analysis has its limitations. In the crypto world, issues like wash trading, fake volume, and low liquidity can skew volume data. Wash trading occurs when traders buy and sell the same asset to artificially inflate its volume, often used by unscrupulous actors to manipulate market perception.
Furthermore, in thinly traded markets, volume can be less reliable as small trades can disproportionately affect the volume reading. This is why it’s essential to combine volume analysis with other indicators to confirm trends and reduce the likelihood of false signals.
Takeaway
Volume is an absolute game-changer for crypto traders. When you understand cryptocurrency trading volume — from assessing market liquidity and sentiment to confirming price trends – you're setting yourself up to make smarter, more strategic decisions. An increase in volume often signals the strength of a trend, whether it's a bullish rally or a bearish pullback, giving you the confidence to navigate the market with clarity.
However, it's important to know that volume trading can have its own limitations like wash trading and fragmented liquidity, which can distort volume data. Therefore, a holistic approach is vital. Combine volume analysis with other technical indicators, chart patterns, and fundamental research to get a comprehensive view of the market.
PS: Are you looking to upskill? Start by exploring the resources available at Learning Crypto. There, you'll find a wealth of information to help you get started with investing in cryptocurrency, understand market dynamics, and develop effective trading strategies. With the right knowledge and tools, you'll be equipped to confidently navigate the exciting world of crypto trading


:max_bytes(150000):strip_icc()/dotdash_INV-final--On-Balance-Volume-OBV-Definition-June-2021-01-16906b2a337a4e59a30a0b7d04a78a8a.jpg?ref=learningcrypto.com)